Eric Weeks
- personal pages - research
- time series analysis
My Adventures in Chaotic Time Series Analysis |
weeks@physics.emory.edu |
Eric Weeks
- personal pages - research
- time series analysis
My Adventures in Chaotic Time Series Analysis |
weeks@physics.emory.edu |
A0. Links and related information
For an explanation of what these pages are all about, select topic 1 above.
This page: top | lorenz | rossler | henon | expt: periodic | qperiodic-2 | qperiodic-3 | chaotic | bottom
![]()
Thanks to Josko Poljak for prompting me to check the autocorrelation functions.
What is autocorrelation? Define the standard deviation sigma_x of a time series x as:
sigma_x = sqrt( < ( x - < x > )^2 > )
That is, take the difference between each point in a time series and the mean of that time series. Square this quantity, find the average over all points, and take the square root; that's the standard deviation. If I could get latex2html to work I'd put in a cleaner formula. The angle brackets in the above formula connote taking the average.
The correlation r between two time series x and y is then defined as:
r = < ( x- < x > ) ( y- < y > ) > / (sigma_x sigma_y)
The autocorrelation r(tau) is given by the correlation of the series with itself; use x(t) and x(t+tau) as the two time series in the correlation formula.
This is a fairly sketchy explanation; you might be interested in the Numerical Recipes explanation. I wrote a program to do the autocorrelation calculation; click here for more information. My program is more inefficient than the Numerical Recipes routine, but is public domain.
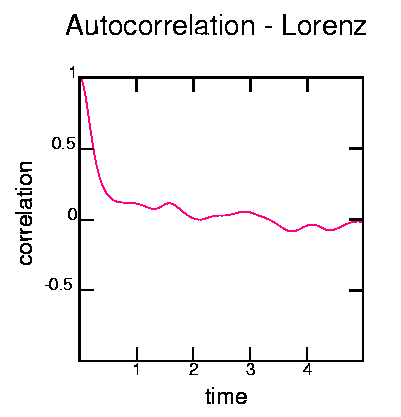
This was generated with the commands: cat lorenz.gz | gawk '{print $2}' | autocor -t 0.01 -d500 | psdraw -l0.05 -S 10 10 -X - - -1 1 -Z 255 0 128 -A -y 0.5 -a "time" -b "correlation" -T "Autocorrelation - Lorenz" < autolor.ps
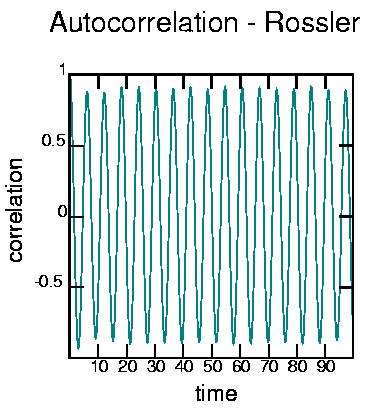
This was made with:
cat rossler.dat | autocor -t 0.1 -d1000 |
psdraw -l0.05 -S 10 10 -X - - -1 1 -Z 0 128 128 -A -y 0.5
-a "time" -b "correlation" -T "Autocorrelation - Rossler" < autoros.ps
This page:
top |
lorenz |
rossler |
henon |
expt: periodic |
qperiodic-2 |
qperiodic-3 |
chaotic |
bottom
Hénon:
time series
|
power spectrum
|
mutual information
|
attractor
|
attractor 3D
|
autocorrelation
|
poincare
|
1-D maps
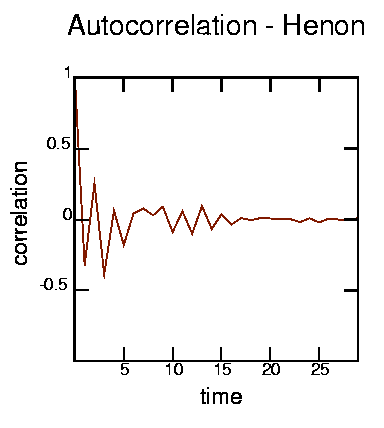
This was produced with the command: cat ../henondat.gz | autocor -d30 | psdraw -l0.05 -S 10 10 -X - - -1 1 -Z 128 25 0 -A -y 0.5 -a "time" -b "correlation" -T "Autocorrelation - Henon" < autohen.ps
This page:
top |
lorenz |
rossler |
henon |
expt: periodic |
qperiodic-2 |
qperiodic-3 |
chaotic |
bottom
Experimental/periodic:
time series
|
power spectrum
|
mutual information
|
attractor
|
attractor 3D
|
autocorrelation
|
poincare
|
1-D maps
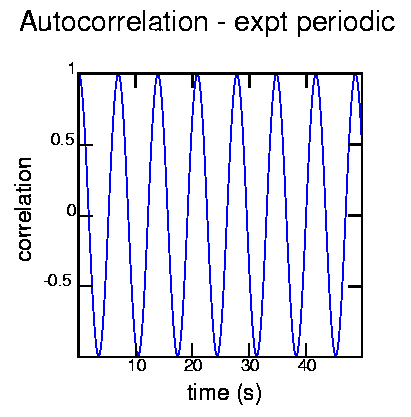
Generated with the commands:
cat exptper.dat | autocor -t 0.1 -d 500 | psdraw -l0.05 -S 10 10 -X - - -1 1 -Z 0 0 255 -A -y 0.5 -a "time (s)" -b "correlation" -T "Autocorrelation - expt periodic" < autoper.ps
This page:
top |
lorenz |
rossler |
henon |
expt: periodic |
qperiodic-2 |
qperiodic-3 |
chaotic |
bottom
Experimental/quasiperiodic-2:
time series
|
power spectrum
|
mutual information
|
attractor
|
attractor 3D
|
autocorrelation
|
poincare
|
1-D maps

Generated with the commands:
cat exptqp2.dat | autocor -t 0.1 -d 1000 | psdraw -l0.05 -S 10 10 -X - - -1 1 -Z 0 0 255 -A -y 0.5 -a "time (s)" -b "correlation" -T "Autocorrelation - expt qp2" < autoqp2.ps
This page:
top |
lorenz |
rossler |
henon |
expt: periodic |
qperiodic-2 |
qperiodic-3 |
chaotic |
bottom
Experimental/quasiperiodic-3:
time series
|
power spectrum
|
mutual information
|
attractor
|
attractor 3D
|
autocorrelation
|
poincare
|
1-D maps

Generated with the commands:
cat exptqp3.dat | autocor -t 0.4 -d 250 | psdraw -l0.05 -S 10 10 -X - - -1 1 -Z 0 0 255 -A -y 0.5 -a "time (s)" -b "correlation" -T "Autocorrelation - expt qp3" < autoqp3.ps
This page:
top |
lorenz |
rossler |
henon |
expt: periodic |
qperiodic-2 |
qperiodic-3 |
chaotic |
bottom
Experimental/chaotic:
time series
|
power spectrum
|
mutual information
|
attractor
|
attractor 3D
|
autocorrelation
|
poincare
|
1-D maps
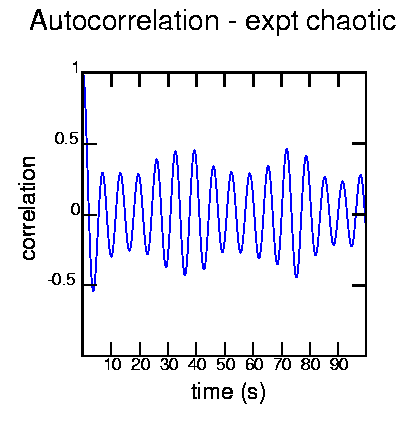
Generated with the commands:
cat exptcha.dat | autocor -t 0.1 -d 1000 | psdraw -l0.05 -S 10 10 -X - - -1 1 -Z 0 0 255 -A -y 0.5 -a "time (s)" -b "correlation" -T "Autocorrelation - expt chaotic" < autocha.ps
The oscillation is because there is still some periodic component to the data, similar to the Rossler attractor.
So far the analysis has given me several different times. From the Fourier transform I have certain characteristic periods. From the mutual information calculation I have the first minimum. I also have the autocorrelation first zero-crossing.
Note that all times are in natural units (seconds for experimental data, iterations for Hénon map, the time step of the equations for the Rössler and Lorenz systems). Links in the table will take you to the appropriate location where the information was found.
![]()
 Previous page: 3-D plots of strange attractors
 Next page: Nothing, yet. Something, soon. Probably Poincare
sections.
This page: top | lorenz | rossler | henon | expt: periodic | qperiodic-2 | qperiodic-3 | chaotic | bottom
![]()