Eric Weeks
- personal pages - research
- time series analysis
My Adventures in Chaotic Time Series Analysis |
weeks@physics.emory.edu |
Eric Weeks
- personal pages - research
- time series analysis
My Adventures in Chaotic Time Series Analysis |
weeks@physics.emory.edu |
A0. Links and related information
For an explanation of what these pages are all about, select topic 1 above.
This page: top | lorenz | rossler | henon | expt: periodic | qperiodic-2 | qperiodic-3 | chaotic | bottom
![]()
I took the Fourier transforms of all of the data sets I have.
Software: You might consider using the Numerical Recipes subroutine for fast fourier transforms. You can download a postscript file of their chapter on FFT's, print it out, and then type in the subroutine. This chapter also would serve as an excellent introduction to the concepts behind a fourier transform and power spectra. Also, Nicholas Tufillaro has a C program available on the web. A good introduction to FFT's on the web can be found at the "Sydney Vislab" computational physics 3 web page.
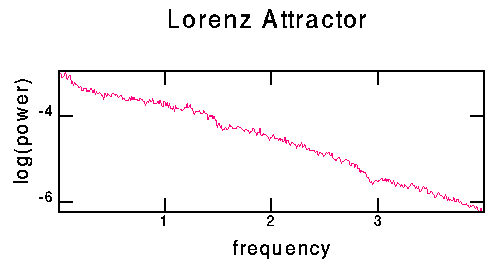
For this data, I created an extra-long time series just to check: despite the wiggles you see in the time series, the power spectrum for the Lorenz attractor really is flat. This Fourier transform was taken with 65536 points, sampled with a time step of 0.1 (with a Runge-Kutta step of 0.01 still). I used overlapping windows of 1024 points.
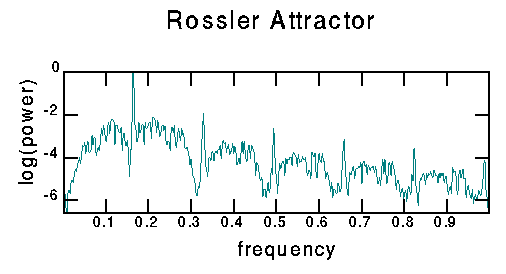
Again, I made an extra-long time series: 8192 points sampled with a time step of 0.1. The Fourier transform was made using three overlapping windows of 4096 points. The peaks correspond to the fundamental frequency and its harmonics. The fundamental frequency is at 0.1646, indicating a period of about 6.1 (in the time unit of the equations).
This page:
top |
lorenz |
rossler |
henon |
expt: periodic |
qperiodic-2 |
qperiodic-3 |
chaotic |
bottom
Hénon:
time series
|
power spectrum
|
mutual information
|
attractor
|
attractor 3D
|
autocorrelation
|
poincare
|
1-D maps

This power spectrum appears weird to me. The maximum resolvable frequency is 1/2 (iteration)^-1, half an inverse iteration time step. I used 16384 points with overlapping windows of 1024 points. The maximum peak in the power spectrum is around 0.455, corresponding to 2.2 iteration steps.
This page:
top |
lorenz |
rossler |
henon |
expt: periodic |
qperiodic-2 |
qperiodic-3 |
chaotic |
bottom
Experimental/periodic:
time series
|
power spectrum
|
mutual information
|
attractor
|
attractor 3D
|
autocorrelation
|
poincare
|
1-D maps

16384 points with overlapping windows of 8192 points to make this power spectrum. The fundamental frequency is at 0.144 Hz, corresponding to a period of about 7 seconds. The data was sampled at 10 Hz.
This page:
top |
lorenz |
rossler |
henon |
expt: periodic |
qperiodic-2 |
qperiodic-3 |
chaotic |
bottom
Experimental/quasiperiodic-2:
time series
|
power spectrum
|
mutual information
|
attractor
|
attractor 3D
|
autocorrelation
|
poincare
|
1-D maps
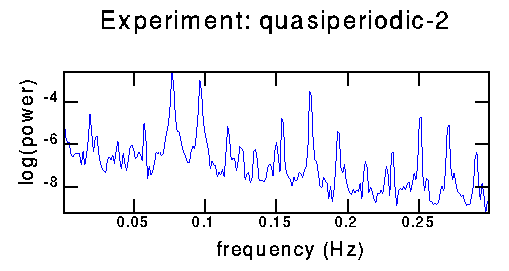
16384 points with overlapping windows of 8192 points to make this power spectrum. The peaks are combinations of two fundamental frequencies at 0.077 and 0.097 Hz, corresponding to periods of 13 and 10 seconds. The data was sampled at 10 Hz.
This page:
top |
lorenz |
rossler |
henon |
expt: periodic |
qperiodic-2 |
qperiodic-3 |
chaotic |
bottom
Experimental/quasiperiodic-3:
time series
|
power spectrum
|
mutual information
|
attractor
|
attractor 3D
|
autocorrelation
|
poincare
|
1-D maps
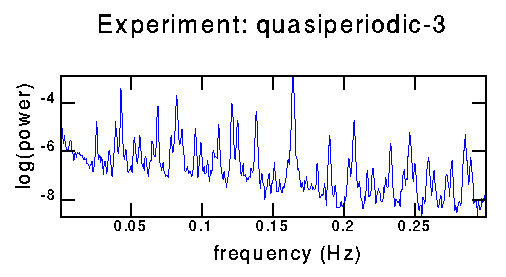
16384 points with overlapping windows of 4096 points to make this power spectrum; data sampled at 2.5 Hz. Complicated as it looks, all of the peaks can be resolved as three fundamental frequencies, and combinations of these three frequencies. It's somewhat difficult to decide which frequencies are the fundamentals and which are the combinations, but reasonable choices appear to be 0.043 Hz, 0.082 Hz, and 0.069 Hz, corresponding to periods of 23, 12, and 14.5 seconds. After much work it is clear that at least three frequencies are needed to account for all of the peaks, and that those three choices do account for all peaks. The biggest peak seen in the spectrum around .16 Hz is at twice 0.082 Hz; it corresponds to a period of about 6.1 seconds.
This page:
top |
lorenz |
rossler |
henon |
expt: periodic |
qperiodic-2 |
qperiodic-3 |
chaotic |
bottom
Experimental/chaotic:
time series
|
power spectrum
|
mutual information
|
attractor
|
attractor 3D
|
autocorrelation
|
poincare
|
1-D maps
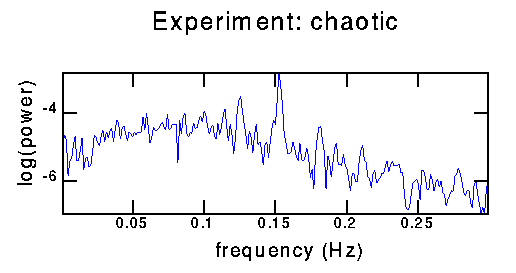
The big peak is at 0.153 Hz, corresponding to a period of about 6.5 seconds. The background level in the power spectrum has gone up quite a lot, providing evidence that this time series is chaotic.
Thus, I'd like to look for a strange attractor or some other signature of chaos, which would be more direct evidence that this is chaos and not just noise. To find a strange attractor, it's important to get a good delay for time-embedding.
 Previous page: plots of the time series.
 Next page: mutual information method to find delay coordinates.
This page: top | lorenz | rossler | henon | expt: periodic | qperiodic-2 | qperiodic-3 | chaotic | bottom
![]()