Eric Weeks
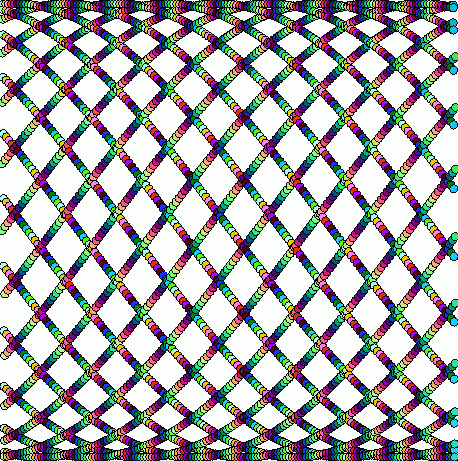
- personal pages - miscOne-liner trigonometric plotA very simple plot created by stringing together a few things. See the bottom of the page for links to other simple algorithms like this one. |
weeks@physics.emory.edu |
Eric Weeks
- personal pages - miscOne-liner trigonometric plotA very simple plot created by stringing together a few things. See the bottom of the page for links to other simple algorithms like this one. |
weeks@physics.emory.edu |

This was created with the following command:
The basic idea is that I'm plotting the trigonometric function sine(x) so quickly that you can't see the waves; instead, you see overlapping sine functions. I'm plotting small colored circles for each point.
This is not technically a one-liner, perhaps, as I'm using two additional programs. The program "seq" is used to print the numbers 0 to 1000 in increments of 0.3. The program psdraw takes the numbers and makes a postscript file, using the 3rd-5th columns of the input to set the RGB colors. The gawk script in the middle generates the data; I choose the various trig functions for the colors somewhat arbitrarily.
Click here for more information on psdraw.
Another version of this picture:

This was made with the command:
![]()


This page created August 22, 1996.