Slightly improved version of this program as of 1/27/98
I decided to write a very simple program called "psdraw" which
would take (X,Y) values and print them on a PostScript page.
Then I could add the pictures to my web page (
see Sec. 1 for information on converting PostScript to gif).
The program can produce graphs with axes and labels
and such, or can produce simple drawings without axes.
This program can print lines connecting the points, or just print a
circle at each point. In addition, the color of each point can be
specified by giving the program the data in (X,Y,R,G,B) form (red,
green, blue colors). This program also has a crude way to plot 3D data (see
below).
Currently I've made a couple pictures with this program
(a simple picture to test the program and
one of my old favorites, a fractal coral generator)
.
I add features to this program from time to time, mainly when I
find something new I need to do, or occasionally by someone's
request.
 Click here to see the source code for the program.
To compile, use the command
gcc dps.c -lm
How to use:
You can use psdraw in a pipe, or with a filename:
zcat datafile.Z | psdraw > output.ps
psdraw datafile > output.ps
EXAMPLE:
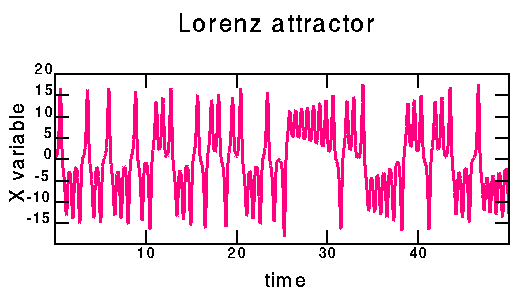
The plot below was generated with the command:
cat data | psdraw -Z 255 0 128 -X - - -20 20 -S 15 6 -l 0.1 -A -x 10 -y 5
-a "time" -b "X variable" -T "Lorenz attractor" > vlorenz.ps

Options:
-h : prints out a help message
-H : lists advanced options
-Z # # # : use this color for the data color, with the color
given by RGB values between 0 and 255 (0 0 0=black, 255 255 255=white).
This sets the color of lines connecting data points, or the color
of the outlines of the circles if the -c option is used. The -C
option overrides this option.
-c # : rather than connecting successive points with lines, plot a
circle at each point. Must specify the radius of the circle
(in centimeters).
-f # # # : fill each circle with specified color, with the color
given by RGB values between 0 and 255 (0 0 0=black, 255 255 255=white)
-C : color is specified with each point. That is, each line of
the input contains five numbers, (x,y,red,green,blue).
-O : do not show the outline of each circle. This is useful with the
-C option, as the outline is always the same color (black by default,
or as set with the -Z option).
-X # # # # : this sets the ranges for the x and y axes. The program
uses the maximum & minimum values by default. The four numbers
are (min x, max x, min y, max y). If you use a "-" instead of a
number, it uses the default. Thus -X - - 10 20 has the x-axis
as appropriate for the data, and the y-axis ranging from 10 to 20.
-A : use axes. This draws a box around the data and puts what
the program thinks are appropriate tick-marks and lables.
-x # : use specified x-axis spacing rather than default tick-marks.
-y # : use specified y-axis spacing rather than default tick-marks.
-a "this is the lable of the x-axis" : lable x-axis
-b "this is the lable of the y-axis" : lable x-axis
-T "This is the Title of the Graph" : put title on graph
-S # # : controls the physical size of the graph drawn on the page, in
centimeters. Default is 15 by 15. The two arguments -S takes
are the horizontal and vertical sizes.
-l # : sets the linewidth, if a line is drawn connecting points.
This does not affect lines drawn for the axis.
-L : toggles line usage. If -c option used, -L turns lines on.
Otherwise, -L turns lines off.
UNUSUAL OPTIONS:
-z : read in 3-D data (input must be in form (x,y,z)). See below.
-o # # : adjusts the physical placement of the graph on the page
If you have questions, please let me know. (My email address is at
the bottom of the page.)

3-D Plotting
This is somewhat crude, but it seems to work. By using the -z option
on the command line, you can give the program data in the form (x,y,z).
The program figures out the maximum and minimum z values, and colors
each (x,y) point based on the z value (minimum = white, maximum =
black). This provides a sort of 3-D effect. Works quite well when you
also use my program rotate before psdraw;
click
here to learn about the rotate program. NOTE: For
best results, sort the data from z minimum to z maximum before you use
psdraw. This puts the light points behind the dark points, as it should
be.
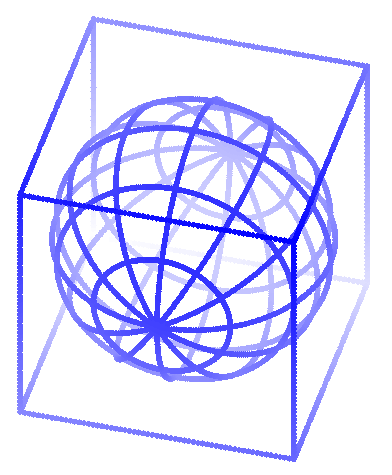
The picture below was made with the following command:
rotate -s 60 -t 15 -p 40 sphere.dat | sort -n +2 -3 |
psdraw -zOc0.1 -X -1.5 1.5 -1.5 1.5 -Z 0 0 255 > sphere.ps


Links...
Current address:
Eric R. Weeks
weeks(circle a)physics.emory.edu
Department of Physics
Emory University
Atlanta, GA 30322-2430

 Click here to see the source code for the program.
To compile, use the command
 ![]()

![]()