Eric Weeks
- personal pages - picturesCellular Automata Phase Diagram |
weeks@physics.emory.edu |
Eric Weeks
- personal pages - picturesCellular Automata Phase Diagram |
weeks@physics.emory.edu |
![]()
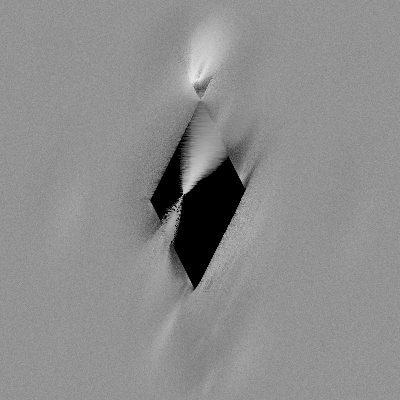
For this last phase diagram, D = 0.2 is fixed. A = C is plotted on the horizontal axis, and ranges from -2 to 2. B is plotted on the vertical axis, and ranged from -2 to 2 (-2 is at the top of the plot). Black is zero, white is 1/2, and this plot isn't periodic.
Click here, or click the picture, to return to the previous page.

![]()
 Click here for information about the software I use to make cellular
automata.