Practice Questions

These questions are designed to test your knowledge of evolutionary game theory, give you practice with problem solving, and prepare you for the type of questions that might appear on an exam. After answering each question, use the ✓ button to see the correct answer. (For best results, avoid the temptation to check the answer before giving the question your best shot!)

What is a pure evolutionarily stable strategy (ESS)?

A pure ESS is a single strategy that, when it is played by all members of the population, cannot be invaded by another strategy that is introduced in small numbers.

What is a mixed evolutionarily stable strategy (ESS)?

Like a pure ESS, a mixed ESS is a strategy that cannot be invaded by another strategy that is introduced in small numbers.
However, the mixed ESS is not a single tactic but a mix of tactics played with a set probability (e.g. play Hawk 75% of the time and Dove 25%).
An evolutionarily stable state is similarly a mix, but results from a genetic polymorphism, with each individual using its tactic all the time; the mix results from different individuals using different strategies (e.g. 75% of individuals always play Hawk and 25% play Dove).

Fill the matrix with numeric payoffs that would make X the only pure ESS in this game.
XY
X
Y


Fill the matrix with numeric payoffs that would make X and Y both pure ESSs in this game.
XY
X
Y


Fill the matrix with numeric payoffs that would result in a mixed ESS of X and Y in this game.
XY
X
Y


What are the pure ESSs (if any) in this game? (Select all that apply.)
XYZ
X231
Y123
Z312


What are the pure ESSs (if any) in this game? (Select all that apply.)
XYZ
X321
Y143
Z212
       

test 

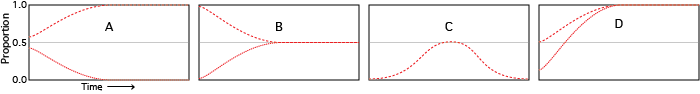
This set of questions refers to the four graphs shown here. Each graph represents change over time in an evolutionary game. The y-axis is the proportion of the population playing a strategy and the x-axis is time. If there are two curves on the same graph, it means that either curve is possible for the strategy. A: Two lines, one going from 60% to 100% and one going from 40% to 0. B: Two lines converging on 50% over time, one from 99% and one from 1%. C: One line rising from 1% to 50% and then going back to 1%. D: Two lines going to 100%, one starting at 10% and one starting at 50%.
The questions ask you to choose the graph that best fits a situation; you may use a graph more than once or not at all.
Which graph shows the proportion of hawks in a Hawk-Dove game where the value of the resource is greater than the cost of losing a fight?


Which graph could show the proportion of hawks in a Hawk-Dove game where the value of the resource is less than the cost of losing a fight?


Which graph shows the proportion of strategy X in this game?
XY
X10
Y01


Which graph shows the proportion of strategy X in this game?
XY
X01
Y10


Which graph shows an dynamic that you would never see in a symmetric two-strategy game?


Which of these could be true of a two-strategy symmetric game with an ESS of 3/4? (Select all that apply)


test 

Even very mundane events can be modeled with game theory. For example, two people simultaneously approach a glass door from opposite sides. When the door is opened, it confers a benefit b to each person, but there’s also a cost c to the one who pushes or pulls the door open. If both people open the door simultaneously, they split the cost equally.
Fill in the payoffs for this game.
OpenWait
Open
Wait


In terms of b and c, what is the evolutionarily stable proportion of door opening?

The answer is (b−c)/(b−c/2). Here’s how to work it out:
We want to find the proportion of Open that makes the average payoffs for Open and Wait equal.
Let p be the proportion of Open. Open meets itself with probability p and obtains the payoff b−c/2. Open meets Wait with probability 1−p and obtains the payoff b−c, so the average total payoff to Open is p(b−c/2)+(1−p)(b−c).
Wait meets Open with probability p and obtains the payoff b. Wait meets itself with probability (1−p) and obtains the payof 0, so the average total payoff to Wait is pb+0.
At the ESS, these two payoffs are equal, so p(b−c/2)+(1−p)(b−c) = pb.
Solvng for p, we find p = (b−c)/(b−c/2).

Of course, we encounter this situation frequently and rarely if ever hesitate to open the door. Assuming the model is valid and there are no other factors, how can you explain this in terms of the payoff matrix and calculated ESS?

The cost is minuscule compared to the benefit. Looking at the ESS, we can see that as c gets very small, p approaches 1.