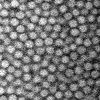
IDL> a = read_gdf('demo.gdf')
IDL> tvscl,a
IDL> help,a
A BYTE = Array[100, 100, 51]
First, read in a 3D image stack. Click here to get readtiffstack. Or, click here to get a zip file containing the demo GDF files.
|
|
IDL> a = readtiffstack('filename.tif'); or... IDL> a = read_gdf('demo.gdf') IDL> tvscl,a IDL> help,a A BYTE = Array[100, 100, 51] |
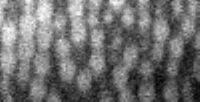
The particles that interest you should be between 5 and 20 pixels in diameter, ideally, in all three dimensions. In a typical case, though, the conversion factor between pixels and microns will not be the same for Z as it is in X and Y. Thus, your spherical particles will appear ellipsoidal, either compressed or stretched in the Z direction depending on the relative values of the Z conversion factor to the X and Y conversion factor. Let's examine this:
|
IDL> tvscl,big(a(*,0,*)) IDL> profiles,big(a(*,0,*)) IDL> yslice,a,0,xscale=2,zscale=2,result; alternate method IDL> profiles,result |
big is a function that doubles the size of the image using the built-in IDL command rebin. yslice is a command that grabs a slice at constant Y (in this case, Y=0) and can stretch it by the given stretch factors in X and Z. If you call yslice with an optional variable at the end, in this case "result", then that variable will contain the image that is displayed. (The default behavior of yslice is to display the image only.) yslice has an advantage that you can play with the scale factors in X and Z until your particles appear roughly round.
Using profiles, I can determine the size of particles in both the X direction and the Z direction. The built-in IDL command profiles lets you move the cursor over the image and determine the coordinates the cursor is at. By moving the cursor to the left & right of two particles, I get the X diameter to be 17 and 16. This image is twice as big since I used big (or, since I scaled by 2 in the X direction using yslice). Thus the true diameter is 16.5/2 = 8.25. The subsequent programs prefer integers, so let's call this a diameter of 8 (in X and Y). In Z, the numbers I get are 22 and 25, for a true diameter of about 11.75. Call this 12. These particles are slightly elongated in the Z direction, but overall this isn't distorted too badly.
|
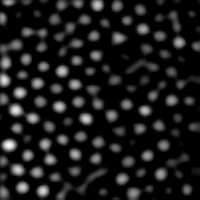
As in 2D, the next step is to bandpass filter the image. The
bpass3d program accounts for the ellipsoidal
distortion by allowing you to choose the bandpass parameters
independently for each dimension. Thus, the low cutoff is a
triple of numbers [1,1,1] in the example below, and the high
cutoff is another triple of numbers [4,4,6] in the example
below.
IDL> b=bpass3d(a,[1,1,1],[4,4,6]) This produces the image at left. |
The second numbers should be something like the radius of the blobs in pixels. I did some experimentation and found that these numbers worked well (see digression for some details of how one defines "working well").
Next we find the coordinates of the particles, now using feature3d instead of the 2D feature. Like bpass3d, feature3d takes triples of numbers for the diameter. In this case, I'm taking the diameter I found previously.
IDL> f = feature3d(b,[8,8,12],sep=[4,4,6],thresh=0.25)
% FEATURE3D: 516 features found.IDL> help,f
F FLOAT = Array[7, 516]
As in 2D, feature3d looks for local maxima (in the bpass3d image) and identifies those as particles. It then looks in a neighborhood around the local maximum, set by the diameter you give it (in this case, [8,8,12] in directions [x,y,z]). It uses this neighborhood to refine the position by finding the "center of mass". Next, the SEP parameter is a radius that says that particles cannot be closer together than twice this radius. Typically set this to half the value of your diameter, although if your diameter is an odd number then you can decide if you want to round up or down for SEP. Additionally, we give the program a threshold value, in the example this is 0.25. This says that we only examine pixels in the neighborhood of the peak that have an intensity at least 0.25 times the peak value. This helps avoid using information from neighboring particles by mistake.
This can find a lot of possible particles in the image, you need to figure out haw to select just the ones you want. The program is intentionally very sensitive, so it would never ignore something you were interested. You have to tell it what to ignore.
Examine the coordinates:
IDL> print, f(0:4,0:2)
      14.0548      2.93872      2.33694      44985.4      7.96243
      5.93881      4.05561      5.98728      53517.6      8.64958
      33.9680      18.1626      4.01610      42746.2      8.22357
f consists of 7 columns of data, one 'row' for each particle in the image. The numbers are (1) x-centroid (2) y-centroid (3) z-centroid (4) total brightness (5) squared radius of gyration (6) peak height of feature (7) fraction of voxels of this particle above threshold. You will be most interested in the x,y,z coordinates, of course, but the other data allow you to 'discriminate' wanted from unwanted particles.
You can also compare your original image with where the particles were found:
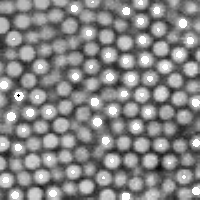
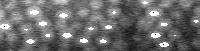
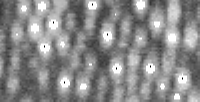
|
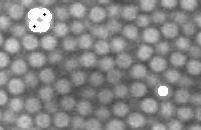
IDL> fo=fover3d(a,f,/big) IDL> movie,fo; click image at left to see movie IDL> tv,fo(*,*,20) |
The option /big doubles the size of the picture to make it easier to see, although if your original image is already big you shouldn't need to do this. The function fover3d returns an image stack. So, look at the dots in all the images, see that you found the guys that you wanted and guys you didn't. Click on the image above to see what this movie looks like. Watch different sections, and whenever a new particle comes into focus, watch it to see that eventually it gets a white dot marking it, before it goes out of focus.
You can also look at an XZ cut:
|
IDL> tv,fo(*,50,*); left image IDL> tv,rebin(reform(fo(*,50,*)),200,102); right image IDL> yslice,fo,50; another way to make left image IDL> yslice,fo,50,z=2; another way to make right image IDL> fo2=transpose(fo,[0,2,1]) IDL> help,fo2 FO2 BYTE = Array[200, 51, 200]IDL> fo3=rebin(fo2,200,51*2,200) IDL> movie,fo3; click right image to see movie |
|
Next we want to discriminate the particles by size and brightness. However, for this data set, we are studying a dense set of particles. feature3d constrains the particles so that they never overlap each other. Given that there are no "holes" in the data set, in this case, it is unlikely we will find any particles where they do not exist. (Our bigger problem is making sure we find all the particles that do exist.)
Anyway, as with 2D pre-tracking, feature3d takes a masscut keyword if you want to use it, to reject any particles ahead of time that have a mass that is too small. For these dense samples, I don't use this keyword, preferring instead to do the selection later.
|
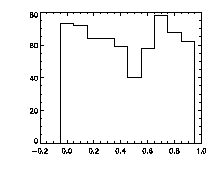
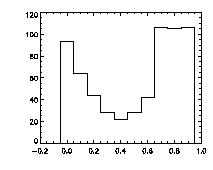
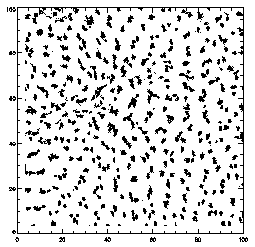
Finally, it's worth checking pixel-biasing at this stage:
IDL> plot_hist,f(0,*) mod 1,charsize=2; top The top histogram is the fractional part of the X positions of the particles, the middle is Y, and the bottom is Z. The X histogram shows a dip in the middle, a possible sign of pixel biasing, although this isn't there in Y, which is a hopeful sign. The Z histogram shows a huge dip and thus the pixel biasing is very bad. Sadly, this is typical for Z, given the limitations of microscope optics. Thus we are not getting subpixel resolution in Z and we might not be doing great in X or Y. Click here for a digression on uncertainty in particle position, and how to improve it using the particle tracking software. What's sad about these pixel-biased histograms is that I spent some time checking a variety of bpass3d and feature3d parameters, and these are the ones that work the best -- see the digression for more details. That is, one can reduce the pixel biasing, but only at the expense of introducing other errors. This is an inherent limitation of dense colloidal samples and would not be a problem for a dilute system. |
Congratulations! You've done about 80% of what you have to do.
We have a procedure to do this for you, ept3d. It lets you set all of the parameters you need. You can apply this procedure to many files at once; the files can be movies or single images. You should read it over to see what it is doing. The goal of ept3d is to create a file of coordinates 'pt.fname' for every z-stack file. Run ept3d:
IDL> ept3d,'demo*gdf',bplo=[1,1,1],bphi=[4,4,6],dia=[8,8,12],sep=[4,4,6],/gdf
Then, read in all of the pt files by using catptdata:
IDL> pta=catptdata('pt.demo*')
IDL> write_gdf,pta,'pta.demo.gdf'
IDL> help,pta
PT FLOAT = Array[8, 374124]
The files contain data for many particles in many different frames. To keep track of which frame a particle was found, an additional 'time' column is added to the data. That is, the coordinates for each frame are just 'concatenated vertically', with a time label (pta(7,*)).
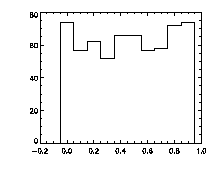
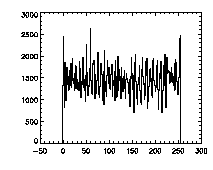
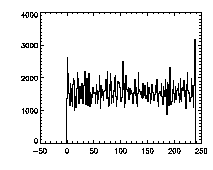
First, let's check the pixel biasing:
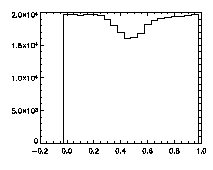
|
IDL> plot_hist,pta(0,*) mod 1 IDL> plot_hist,pta(1,*) mod 1 IDL> plot_hist,pta(2,*) mod 1 The first and second plots are at left, the third at right. |
|
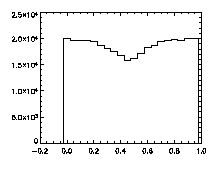
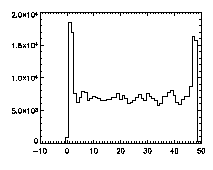
The next thing is to clip the data at the edges. If we plot a histogram of the data in X, Y, and Z, we notice tall peaks near the edges:
|
IDL> plot_hist,pta(0,*),binsize=1 IDL> plot_hist,pta(1,*),binsize=1 IDL> plot_hist,pta(2,*),binsize=1 The first and second plots are at left, the third at right. |
|
The edge peaks aren't too bad in X, a little more noticable in Y, and very obvious in Z. This is because particles near the edge get misidentified. To deal with this, clip out the edges:
IDL> x1=min(pta(0,*),max=x2)
IDL> y1=min(pta(1,*),max=y2)
IDL> z1=min(pta(2,*),max=z2)
IDL> d=3
IDL> ptb=eclip(pta,[0,x1+d,x2-d],[1,y1+d,y2-d],[2,z1+d,z2-d])
|
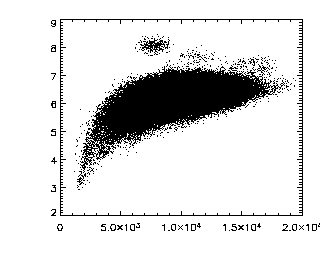
This next command verifies that you have a nice cloud of
data in the brightness-radius space. If you have two or more
clouds, figure out which cloud is for particles and which ones
are artifacts, then either rerun ept3d with different
parameters, or get rid of the data using some other method.
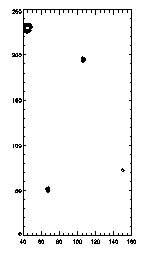
IDL> plot,ptb(3,*),ptb(4,*),/ynozero,psym=3,chars=2 |
As always, you can clip and check with fover3d to see what's doing what. As an example, let's look at those big particles...
|
IDL> ptc=eclip(ptb,[4,7.5,9]); 7.5 < r < 9 IDL> plot,ptc(0,*),ptc(1,*),psym=4,/isotropic; left picture
IDL> w=where(ptc(7,*) eq 0); time=0 |
|
(By the way, I should note that this particular data set is from very old data, more typically we have cleaner data sets! This particular batch of colloids was more prone to having some odd large particles here and there. But it makes a good example of things that can go wrong.)
There are also some particles with smaller than average radius. For now, I'm going to just keep the particles with a radius between 4.5 and 7.5:
IDL> ptc=eclip(ptb,[4,4.5,7.5])
Unlike in 2D, feature3d doesn't calculate the eccentricity, but it does calculate other parameters (as listed above). You could check all of them, for example plotting column M against column N where M,N are {3,4,5,6}. But, in practice, I find that columns 3 and 4 (mass and radius) are the only ones that ever seem useful for clipping.
So, suppose we have gotten rid of these particles -- either by using where, eclip, changing the ept3d parameters, or improving the imaging. Let's take a quick look:
 |
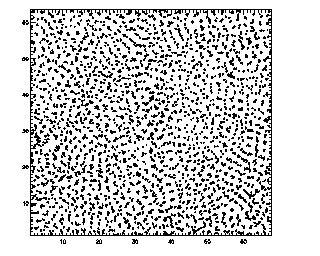
IDL> plot,ptc(0,*),ptc(1,*),xrange=[0,100],yrange=[0,100],/isotropic,psym=3
This is the projection of the particles that were found, projected onto the XY place. Some particles which look close together are probably far apart in Z. You can see that the particles aren't moving much. This is a dense colloidal sample, close to the glass transition, and so mostly particles are moving only locally, and can't rearrange. |
Next, calibrate your data. This is especially important for 3D tracking, as the tracking program (Part 3 below) assumes that particles can take steps of equal length in any direction. However, your raw pixels are not "cubical" and thus a step N pixels in X is different than a step of N pixels in Z. For this data set, we have 0.269 microns per pixel in X and Y, and 0.20 microns per pixel in Z. After calibrating, I often write out this file for backup purposes -- the pretracked data, clipped and calibrated.
IDL> ptc(0,*) = ptc(0,*) * 0.269
IDL> ptc(1,*) = ptc(1,*) * 0.269
IDL> ptc(2,*) = ptc(2,*) * 0.200
IDL> write_gdf,ptc,'ptc.demo.gdf'
In case you're curious, you can inspect some of these demonstration GDF files yourself. Just in case I have also provided a text file for one and a text reader.
IDL> ptc = read_gdf('ptc.demo.gdf')
IDL> tr = track(ptc,0.6,goodenough=10,memory=5,dim=3)
IDL> help,ptc,tr
PTC             FLOAT     = Array[8, 273449]
TR              FLOAT     = Array[9, 272269]
(You can see we've tracked almost all of the particles that were pretracked.) For the track array tr, the first seven columns are from feature3d (x,y,z,brightness,radius,etc,etc), the eighth column is the timestamp (from catptdata), and the final column is a unique particle ID# assigned by track. Thus:
|
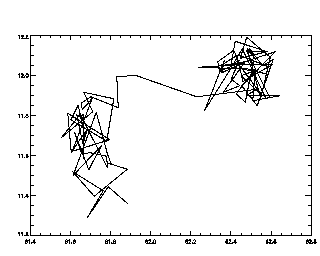
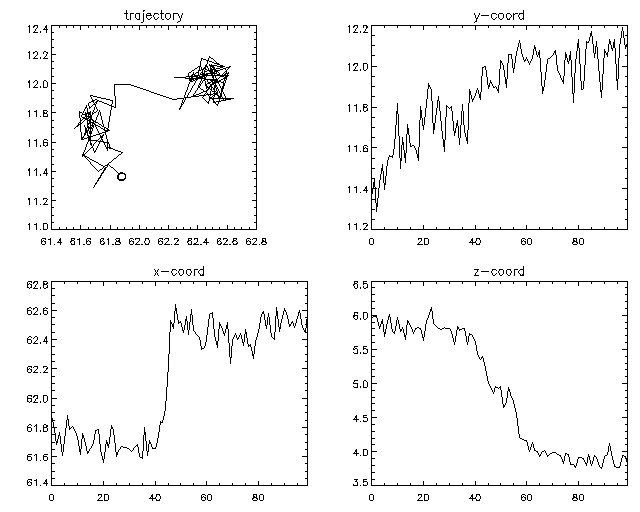
IDL> w=where(tr(8,*) eq 2641) IDL> plot,tr(0,w),tr(1,w),/isotropic,/ynozero or this will do the same thing:
IDL> plotx,tr,2641,/x,/y This is the trajectory for particle #2641. To see all of the trajectories: |
|
IDL> plottr,tr The program does a pretty good job tracking everything, not surprising since particles are 2 microns in diameter but move typically half a micron or less between each image. |
|
Another useful command for looking at lots of trajectories is
seeall, documented in the 2D tutorial. Normally
you just call that program and it lets you look at every
trajectory one at a time, or if you like you can select a
specific trajectory with the ID keyword:
IDL> seeall,tr,id=2641 You can see in this case that as the particle makes a jump in the X coordinate, it is also moving in Z (bottom right graph), and after the jump in X is finished, the particle continues slowly moving in Z for a little while longer. Click the picture to see a larger version. |
The most important parameter to check with track is, as in 2D, the maximum displacement allowed -- that first number given when you call track. This is the maximum distance you expect a particle will move between frames: track will search for particles within that distance. You should check this after the fact by making a histogram of the displacements between successive frames.
|
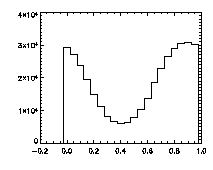
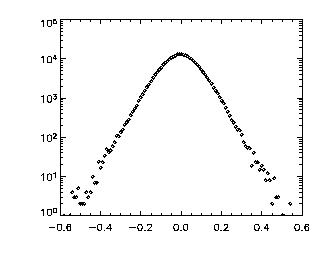
IDL> tr = track(ptc,0.6,good=10,memory=5,dim=3) IDL> p=mkpdf(tr,1,dim=3) IDL> plot_hist,p(0,*),/log; X If the histogram dies gracefully to zero before you get to your maximum displacement (in this case 0.6 microns), you're doing great. mkpdf is a function which returns all of the displacements (dx, dy, and dz) for a given dt, in this case, 1. Now let's check the Z histogram:
|
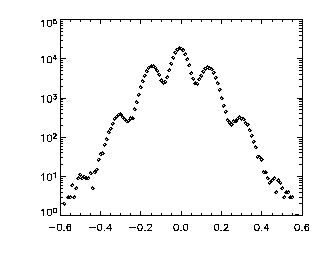
|
IDL> plot_hist,p(2,*),/log; Z This looks worse. It still goes to zero at the edges, which is good. But, it has those strange bumps! That's why this is a good example data set. The bumps are due to pixel biasing and happen around dz = 0.0, 0.2, 0.4, 0.6 (and corresponding negative values). As we noted above, there is bad pixel biasing in Z, meaning that particle Z positions are just about rounded to the nearest pixel. Thus particles in Z, when they move, tend to move in quanta of pixels: You're more likely to see a step from Z = 5.0 to 6.0 (pixels) than to see a step from Z = 5.2 to 5.6 (pixels). Then, when we rescaled Z to microns, we muliplied by 0.2 microns/pixel: thus the jumps now are quantized in quanta of size 0.2 microns, causing these bumps. Since we do have some sub-pixel accuracy, jumps of size different than a multiple of 0.2 microns are possible, just less likely. As mentioned above, none of this is great news for the data, but for this particular data set, we can't do better than this without introducing other errors. Anyway, this is very appropriate for this tutorial as you can often see this in data, and it's good to know what it looks like. Again, if you have a dilute system, it should be easier to get the subpixel accuracy, in which case you would not want to see this in your dz data. |
At this point, this is a good tracked data set, so save a copy:
IDL> write_gdf,tr,'tra.demo.gdf'